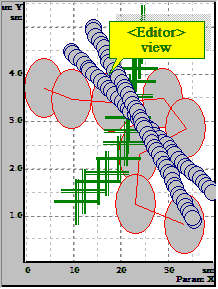
Each point of the chart is drawn with its marker, size and aspect ratio Y/X. The points may be connected by lines.

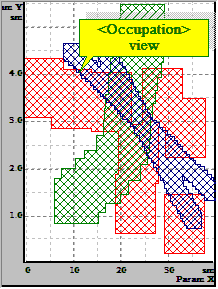
Each point of the chart is drawn with rectangle, but with its color, size and aspect ratio Y/X. The purpose is to display the overlapped points.